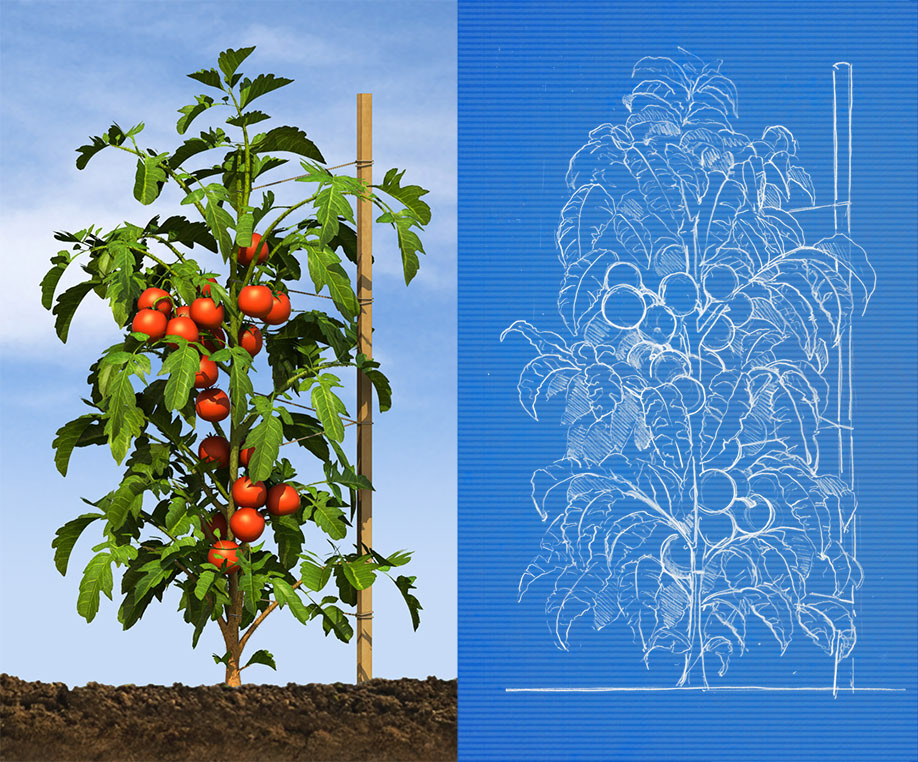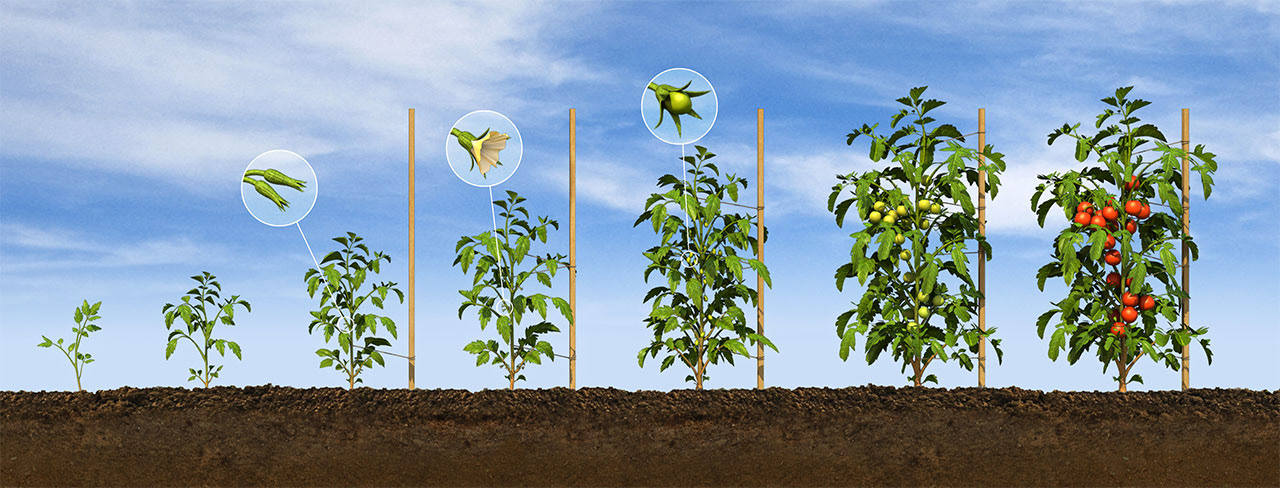
Illustrating a Cycle of Growth – The tomato phenology chart is one in a series of images commissioned by McCormick Company for DuPont to illustrate the key developmental stages in the life cycle of crops. The challenge for tomatoes, as with each project, is accuracy. Based on a descriptive brief provided by the client, an exhaustive hunt for documentation and imagery was launched to facilitate a quick education of how a tomato plant evolves to maturity. The result is an accurate life-like illustration that replaces traditional line drawings.
Composition and illustration by Ryan Etter Illustration, LLC for McCormick Company | DuPont.